Bathyswath Software
Survey Control & Data Visualization
Acquire, filter, visualize, and analyze bathymetric and sidescan sonar data with an advanced real-time processing engine. Built for professional hydrographic surveys, underwater inspection, and seabed mapping.
Brochure not ready yet, check back soon.
Two Applications One Workflow
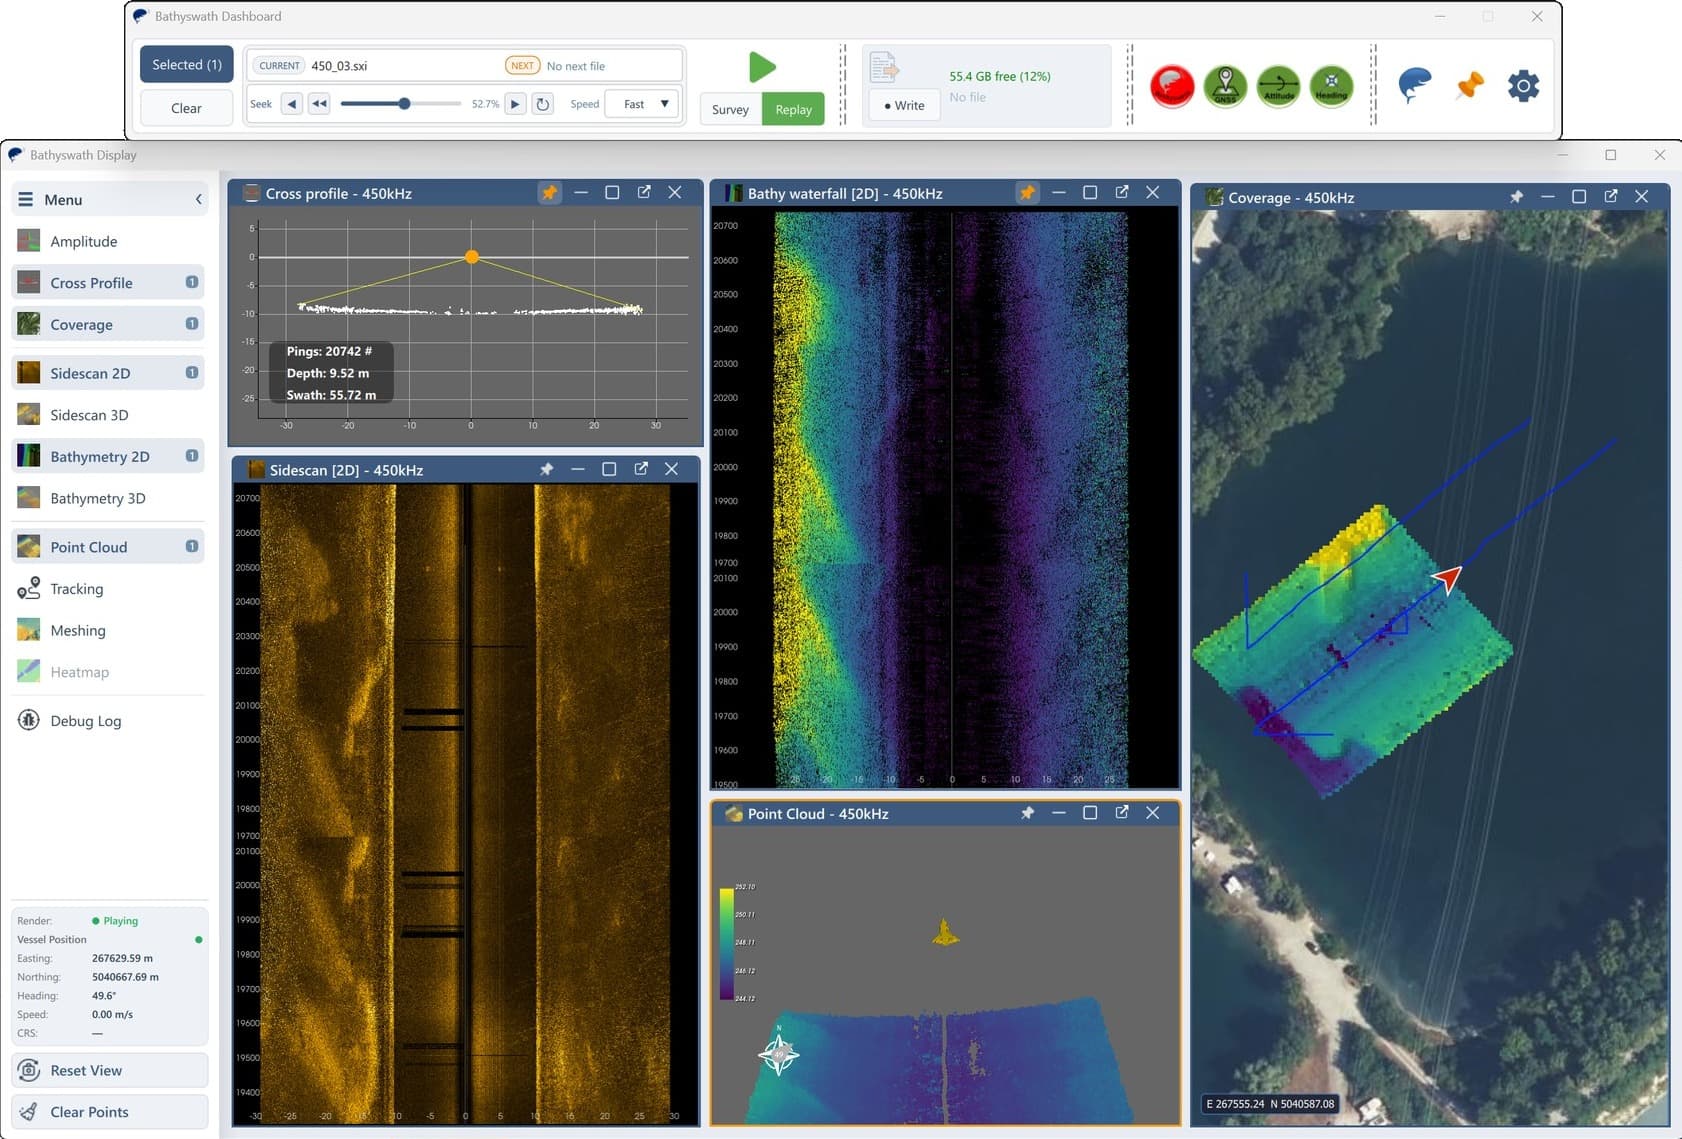
Bathyswath Dashboard controls your survey. BathySwath Display shows you the result. Together they cover the full workflow from acquisition to analysis.
Control your Bathyswath survey environment
Bathyswath Dashboard is where you set up and run a survey, select data sources, switch between Survey and Replay mode, and manage system and technical configuration.
Real-Time Data Acquisition
Live sonar streaming with GNSS/INS monitoring and instant visualization.
Automated Calibration
Roll, pitch, heading and latency calibrated automatically accurate and reliable.
Supported Hardware
Bathyswath, single-beam, and third-party formats (vp2, csv, vel, svp and more), plus custom integrations.
See your survey from every angle
Waterfall
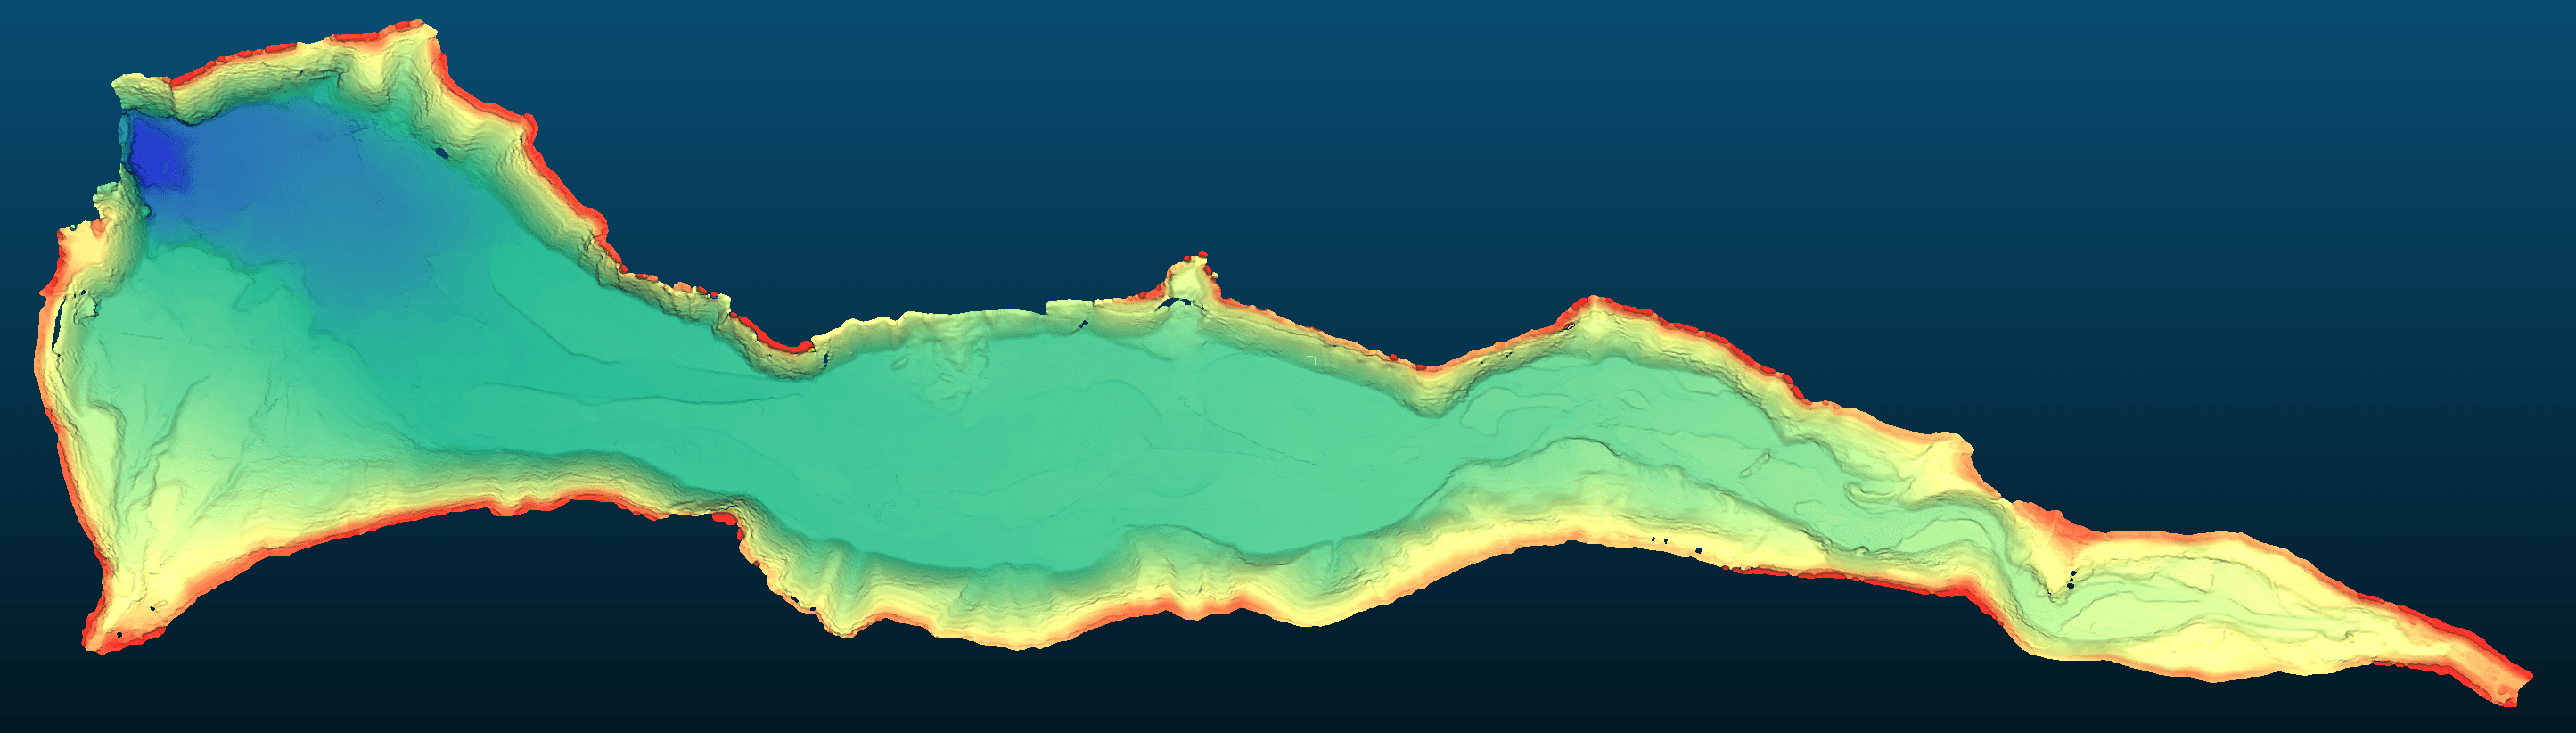
A depth-shaded top-down view of the surveyed seabed.
Designed for Real-Time Survey Operations
BathySwath Sonar
Sends live sounding data
Dashboard
Controls, configures and records the survey
BathySwath Display
2D, 3D, sidescan, coverage and filtering
Results
Classified, processed survey data
Optimized Processing Workflow
Incoming sonar data is processed through a high-performance pipeline for smooth and real-time visualization.
TCP Connection
Raw datagrams received
Decode and validate
2D & 3D Windows
Multi-Frequency Support
Each detected frequency is processed independently with its own filter chain.
View individual frequencies or overlay multiple channels in the same window.
Ready to Transform Your Bathymetric Workflow?
Experience real-time sonar processing, advanced visualization, and powerful filtering in one professional platform.